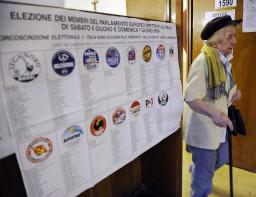
The definitive results for Italian parties in the European Parliament elections are as follows (number of votes and percentage):
People of Freedom - 10,778,453 (35.3%).
Democratic Party - 7,989,435 (26.1%).
Northern League - 3,124,577 (10.2%).
Italy of Values - 2,441,500 (8.0%).
Union of the Centre (UDC) - 1,993,242 (6.5%).
Communist Refoundation Party-European Left - 1,035,189 (3.4%).
Sinistra e Liberta' - 952,507 (3.1%).
Marco Pannella-Emma Bonino List (Radical Party) - 740,260 (2.4%).
La Destra-Movimento per Le Autonomie (MPA)-Pensioners' Party - 680,808 (2.2%)
Fiamma Tricolore - 242,909 (0.8%).
Workers' Communist Party - 165,878 (0.5%).
Forza Nuova - 146.061 0,5 SVP 142,465 (0.5%).
Liberal Democrats-Associative Movement of Italians Abroad - 70,909 (0.2%).
Val D'Aosta - 32,855 (0.1%).
Autonomy Liberty Democracy - 27,030 (0.1%).
A total of 32,659,162 Italians (66.5%) turned out to vote.